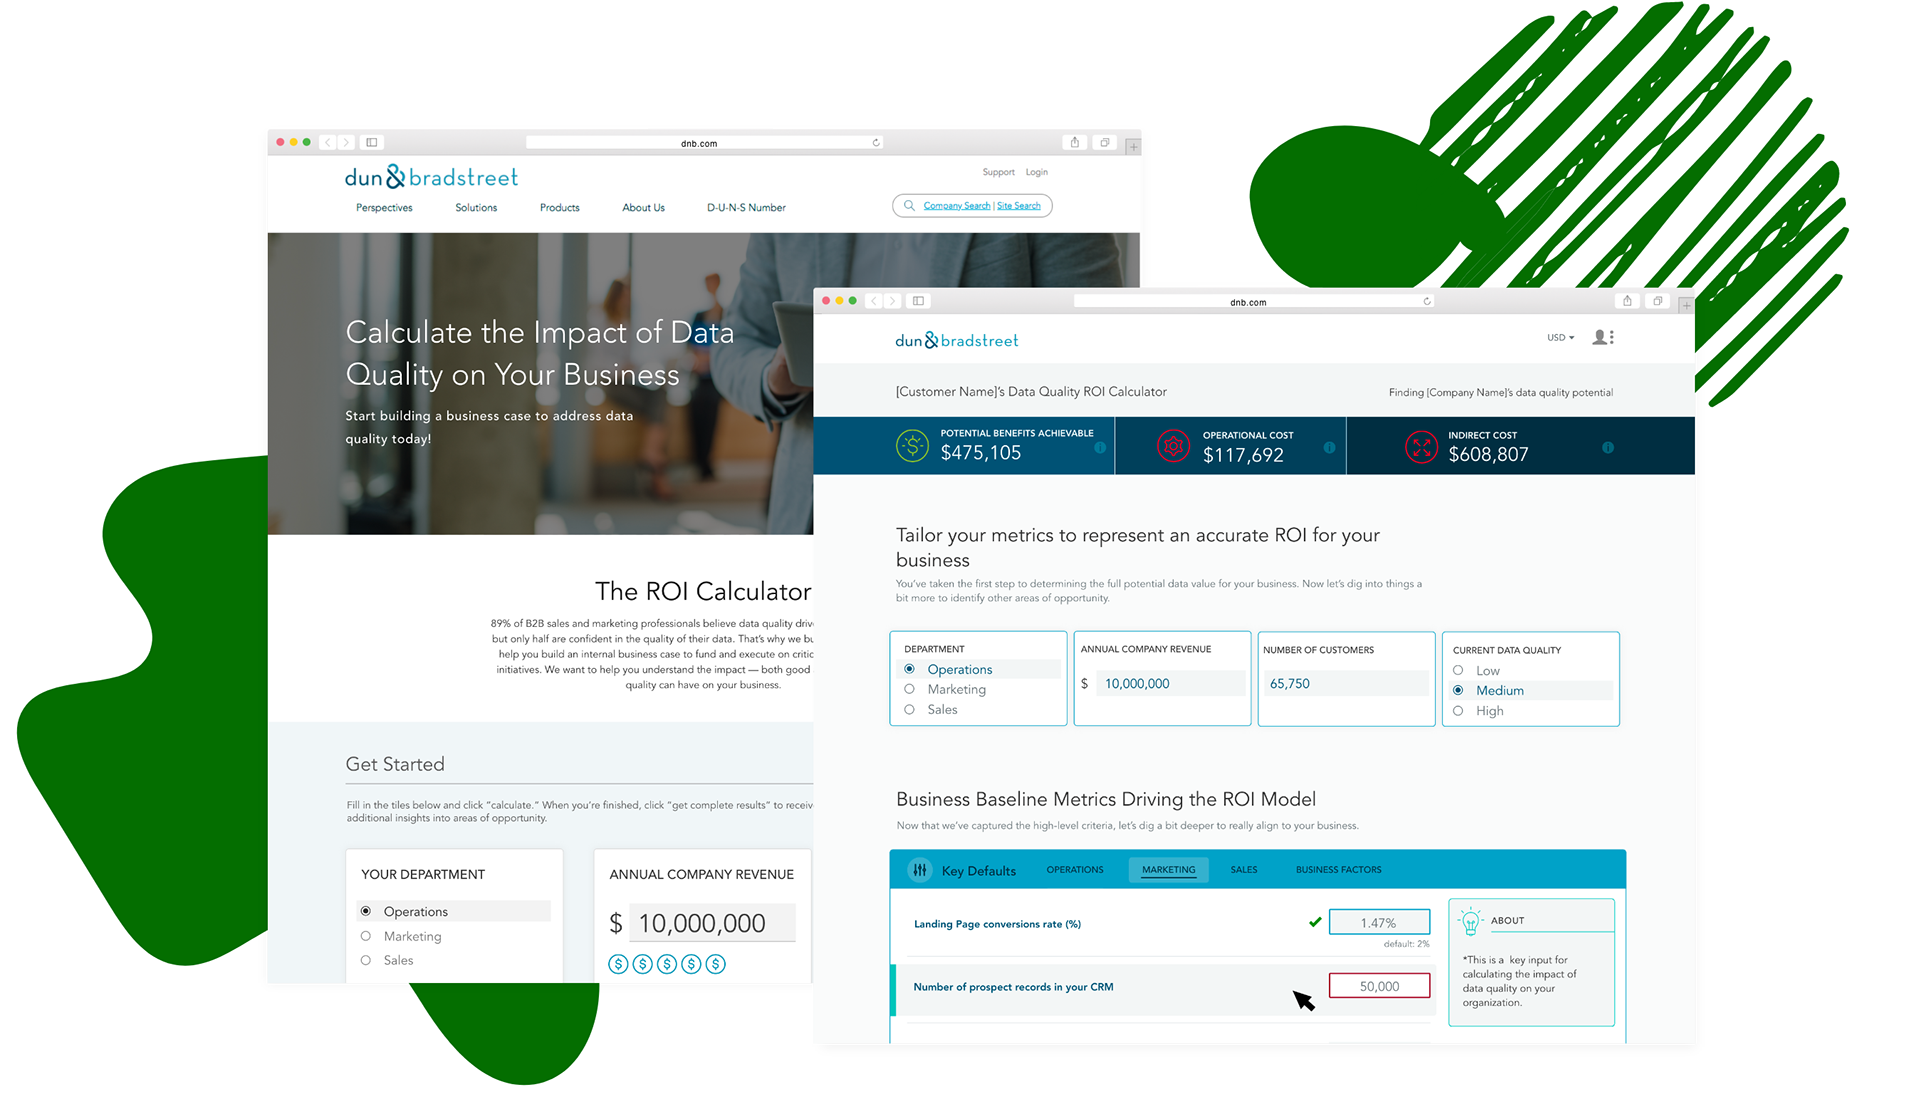
The Data Value ROI Calculator is an interactive tool to help prospects and customers understand the value that good data quality has on their business and the impact poor data quality is having. I worked cross collaboratively with Product, developers, Sales, and Marketing key stakeholders to design 2 experiences, a marketing tool that teases the high level inputs and a pre sales tool used by a sales rep. This was a fast paced, high priority, project commissioned by the GM of the business.
ROLE —- UX + UI
TOOLS —- Adobe XD + Adobe Illustrator + Invision
DURATION —- June 2019 - August 2019
CREDIT —- Madhu Subramanya & Harsh Kotak - production / Julie Saldarriaga & Sean Crowley - copy / Haley Clark - Testing
TOOLS —- Adobe XD + Adobe Illustrator + Invision
DURATION —- June 2019 - August 2019
CREDIT —- Madhu Subramanya & Harsh Kotak - production / Julie Saldarriaga & Sean Crowley - copy / Haley Clark - Testing
WHY?
Organizations struggle to quantify the financial impact that data quality imposes.
SOLUTION
Create an engaging experience that provides personalized insights and promote value-based discussions around the benefits of D&B data and S&MS continuous data management solutions via Paid, Organic, Social and Direct channels.
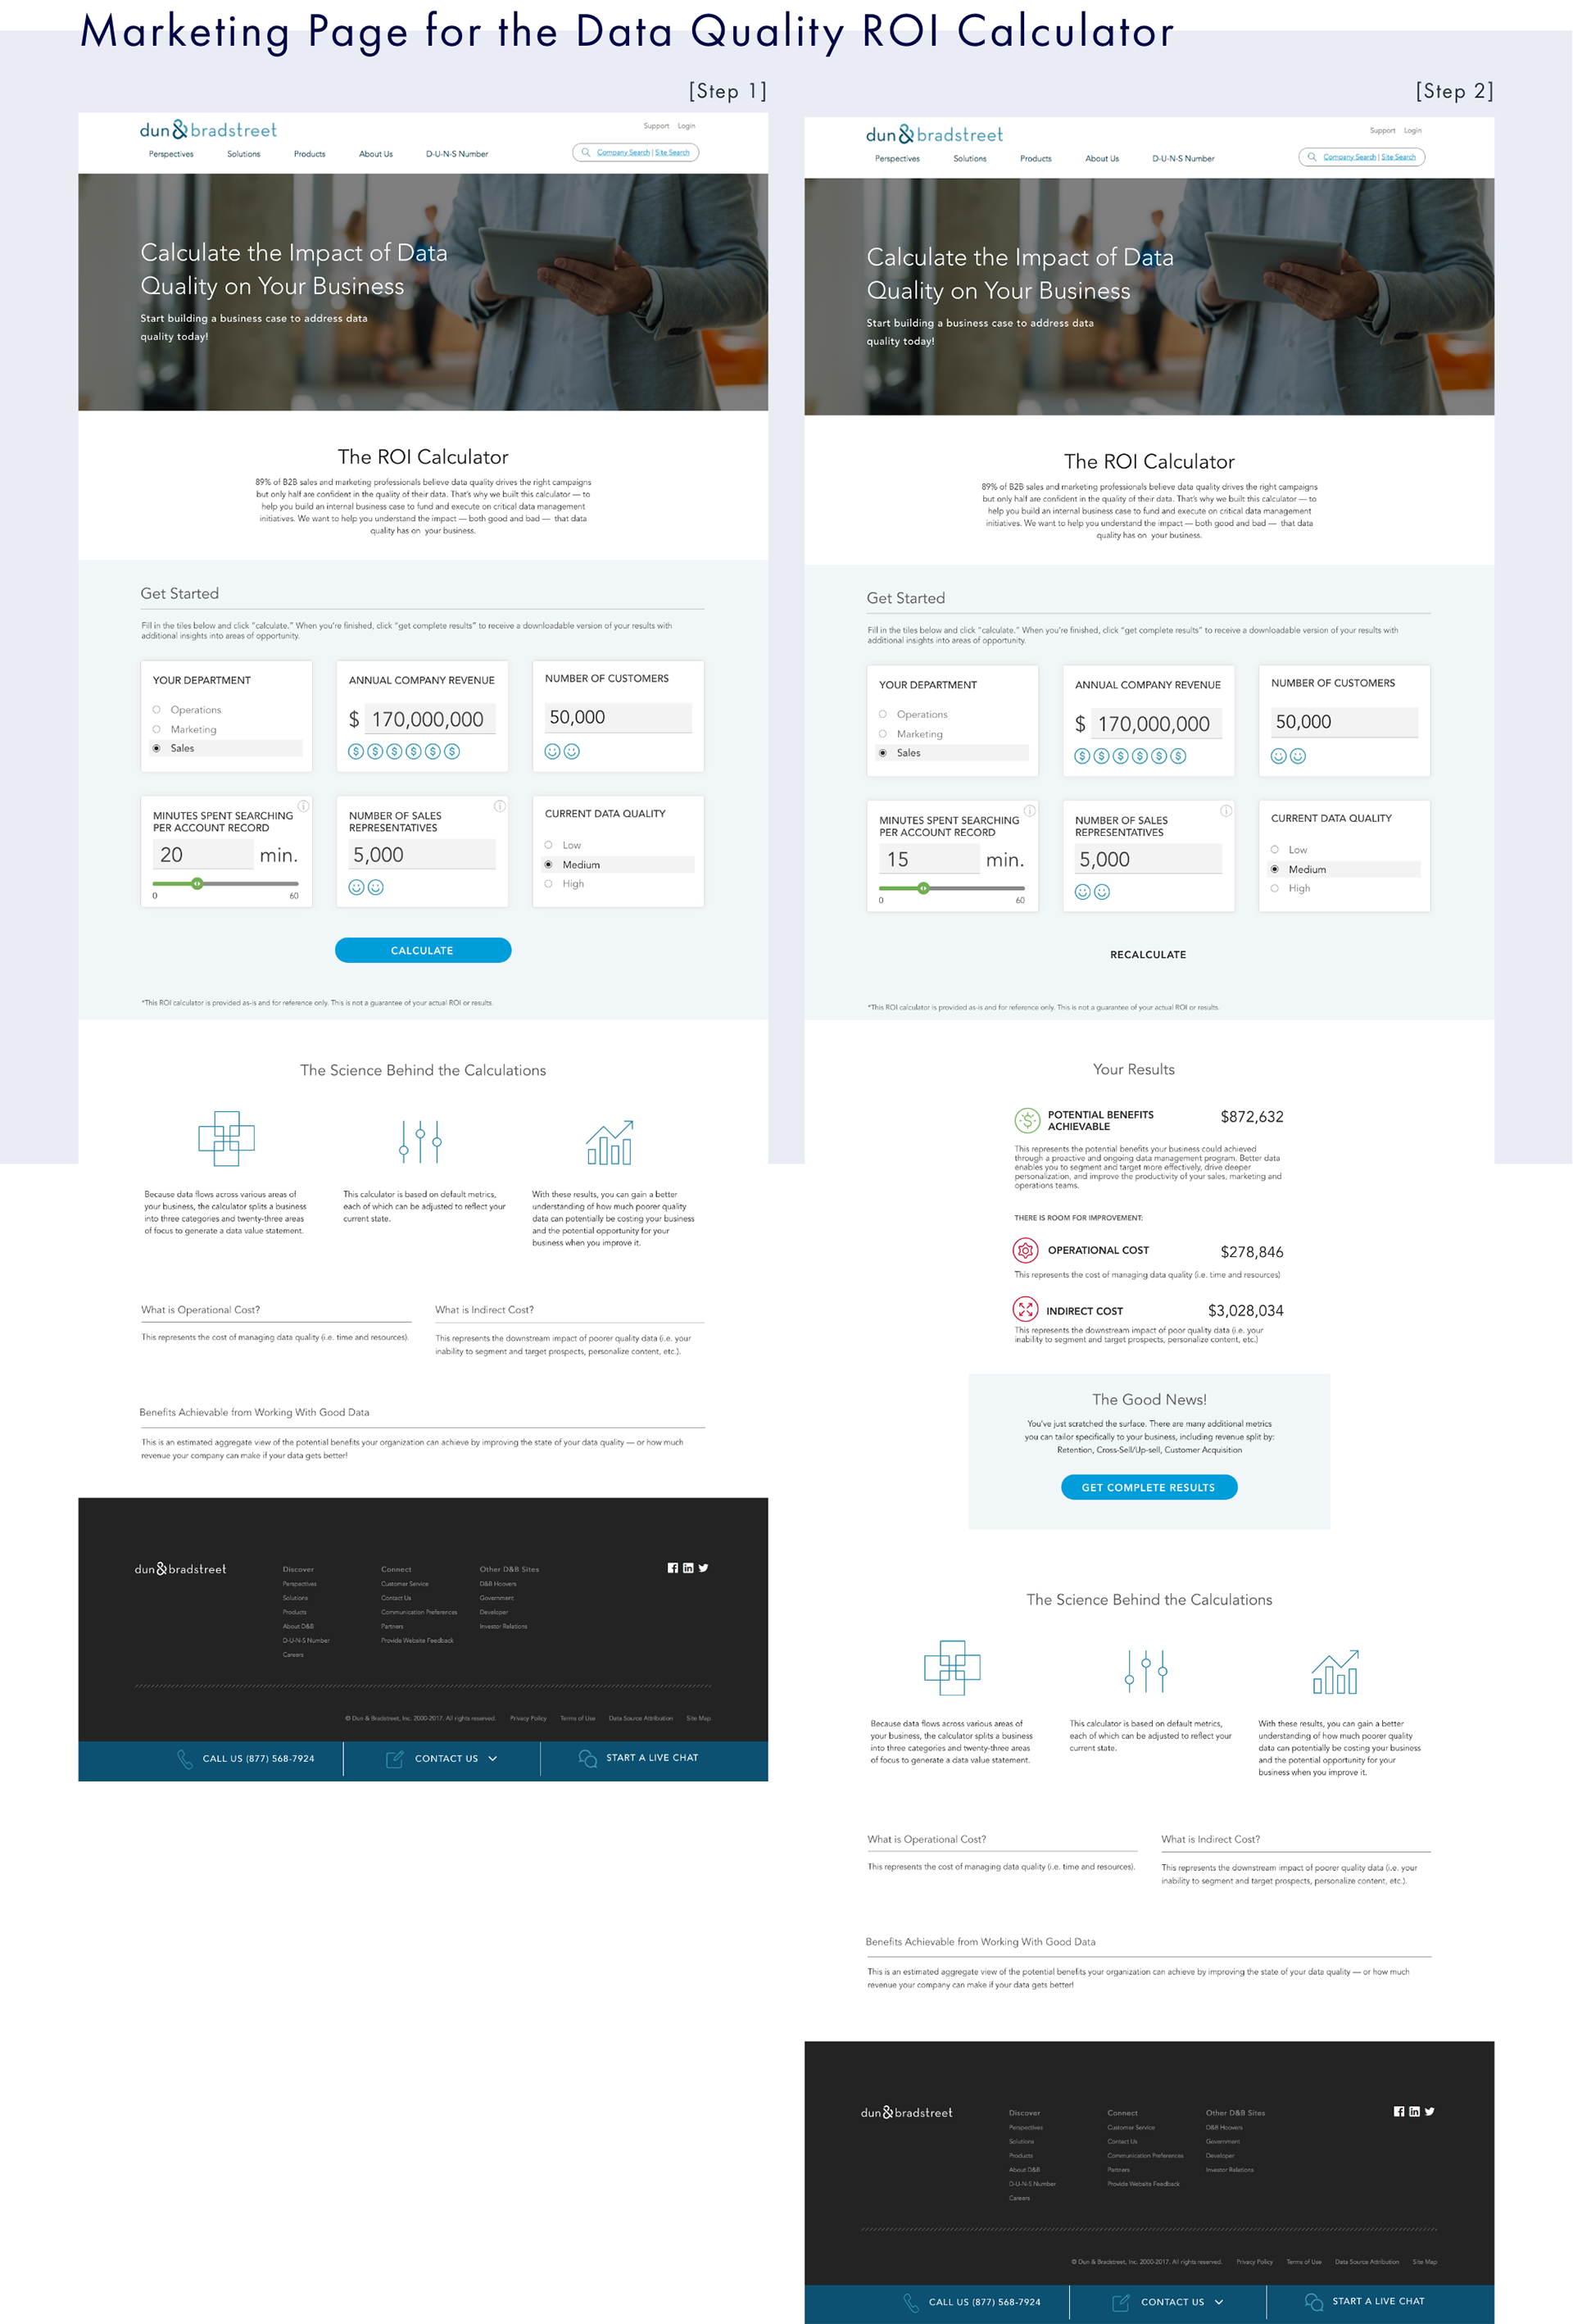
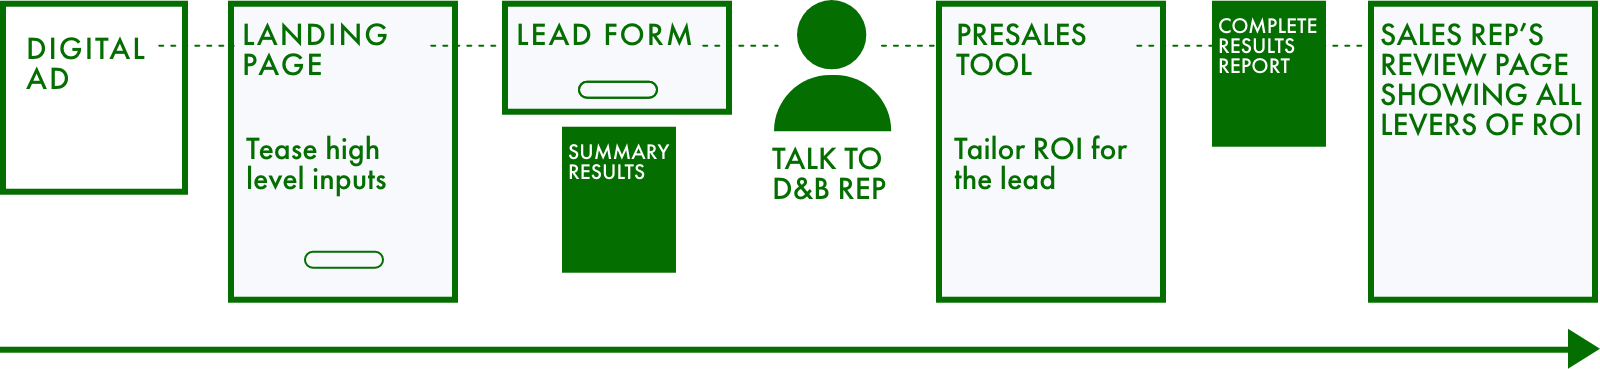
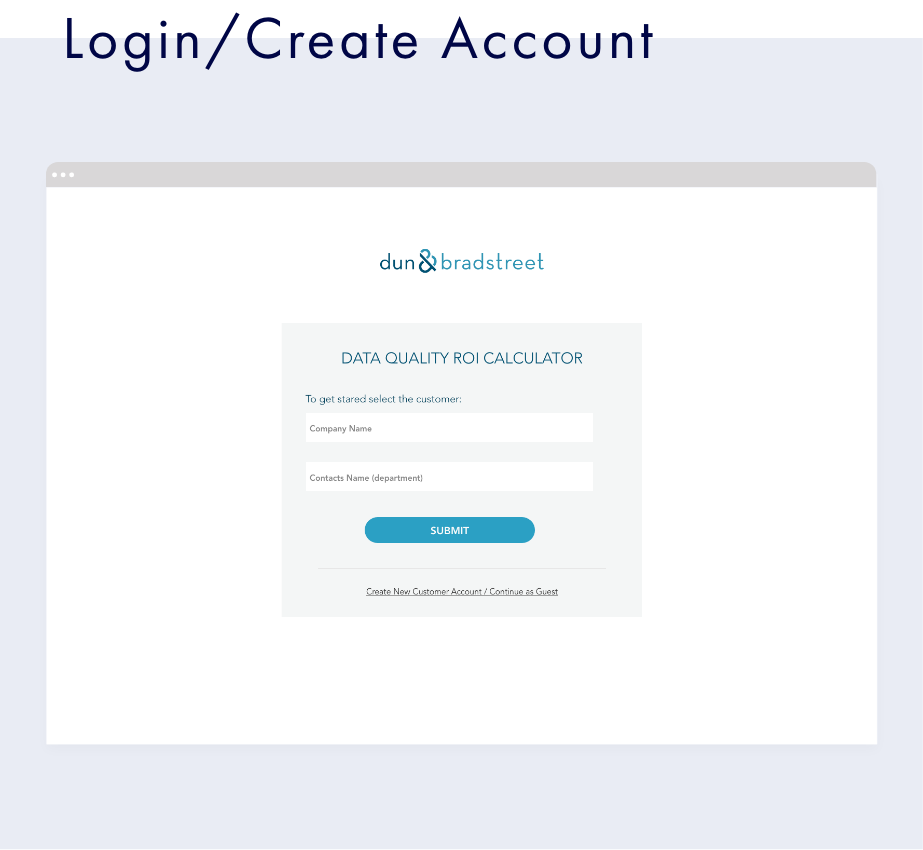
Step 1 : Answer 6 inputs about your organization and ‘calculate’
Step 2 : Preliminary results reveal and you are prompted to ‘get complete results’. A lead form pops up so a sales rep can contact you and tailor the metrics to your organization.
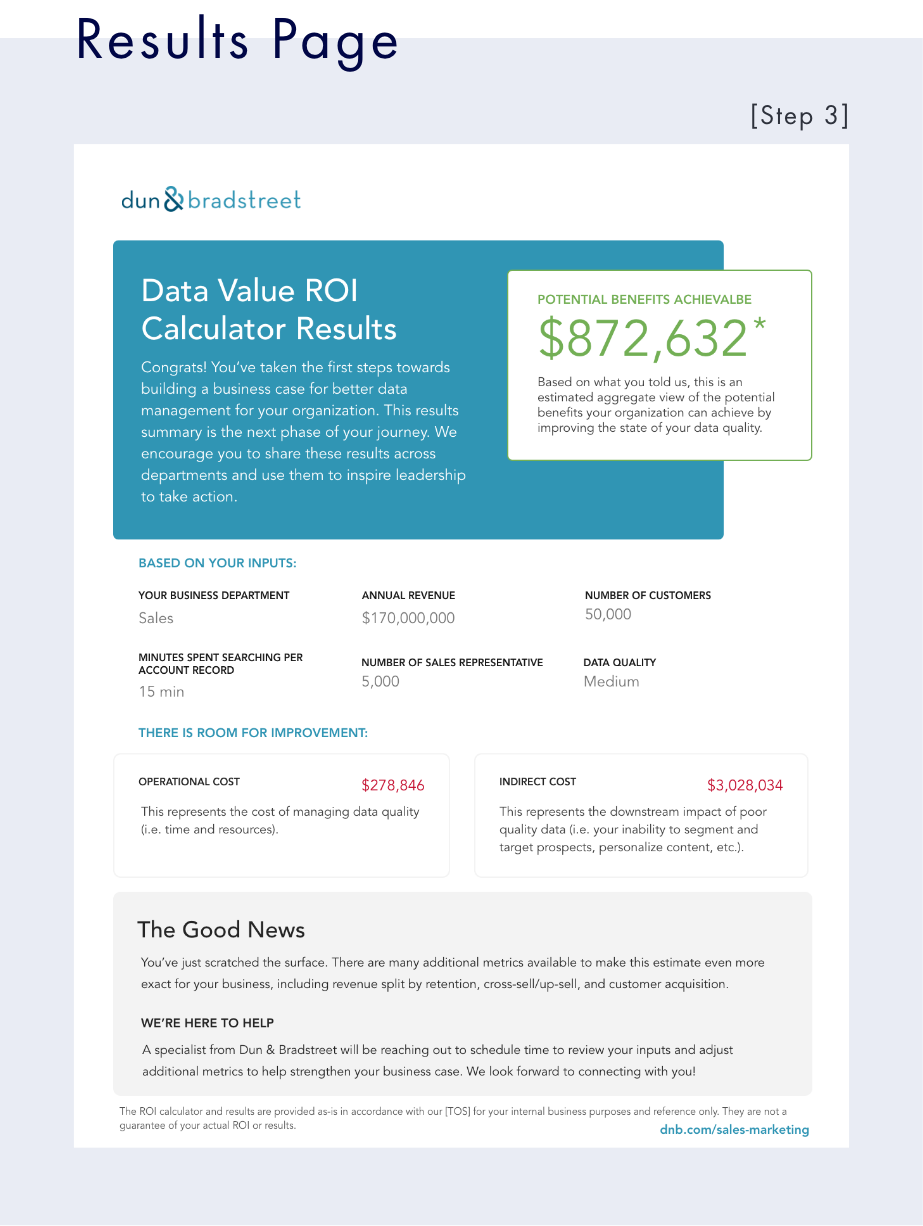
Step 3 : A summary pdf downloads so you can share your results with colleagues
Step 2 : Preliminary results reveal and you are prompted to ‘get complete results’. A lead form pops up so a sales rep can contact you and tailor the metrics to your organization.
Step 3 : A summary pdf downloads so you can share your results with colleagues
APPROACH
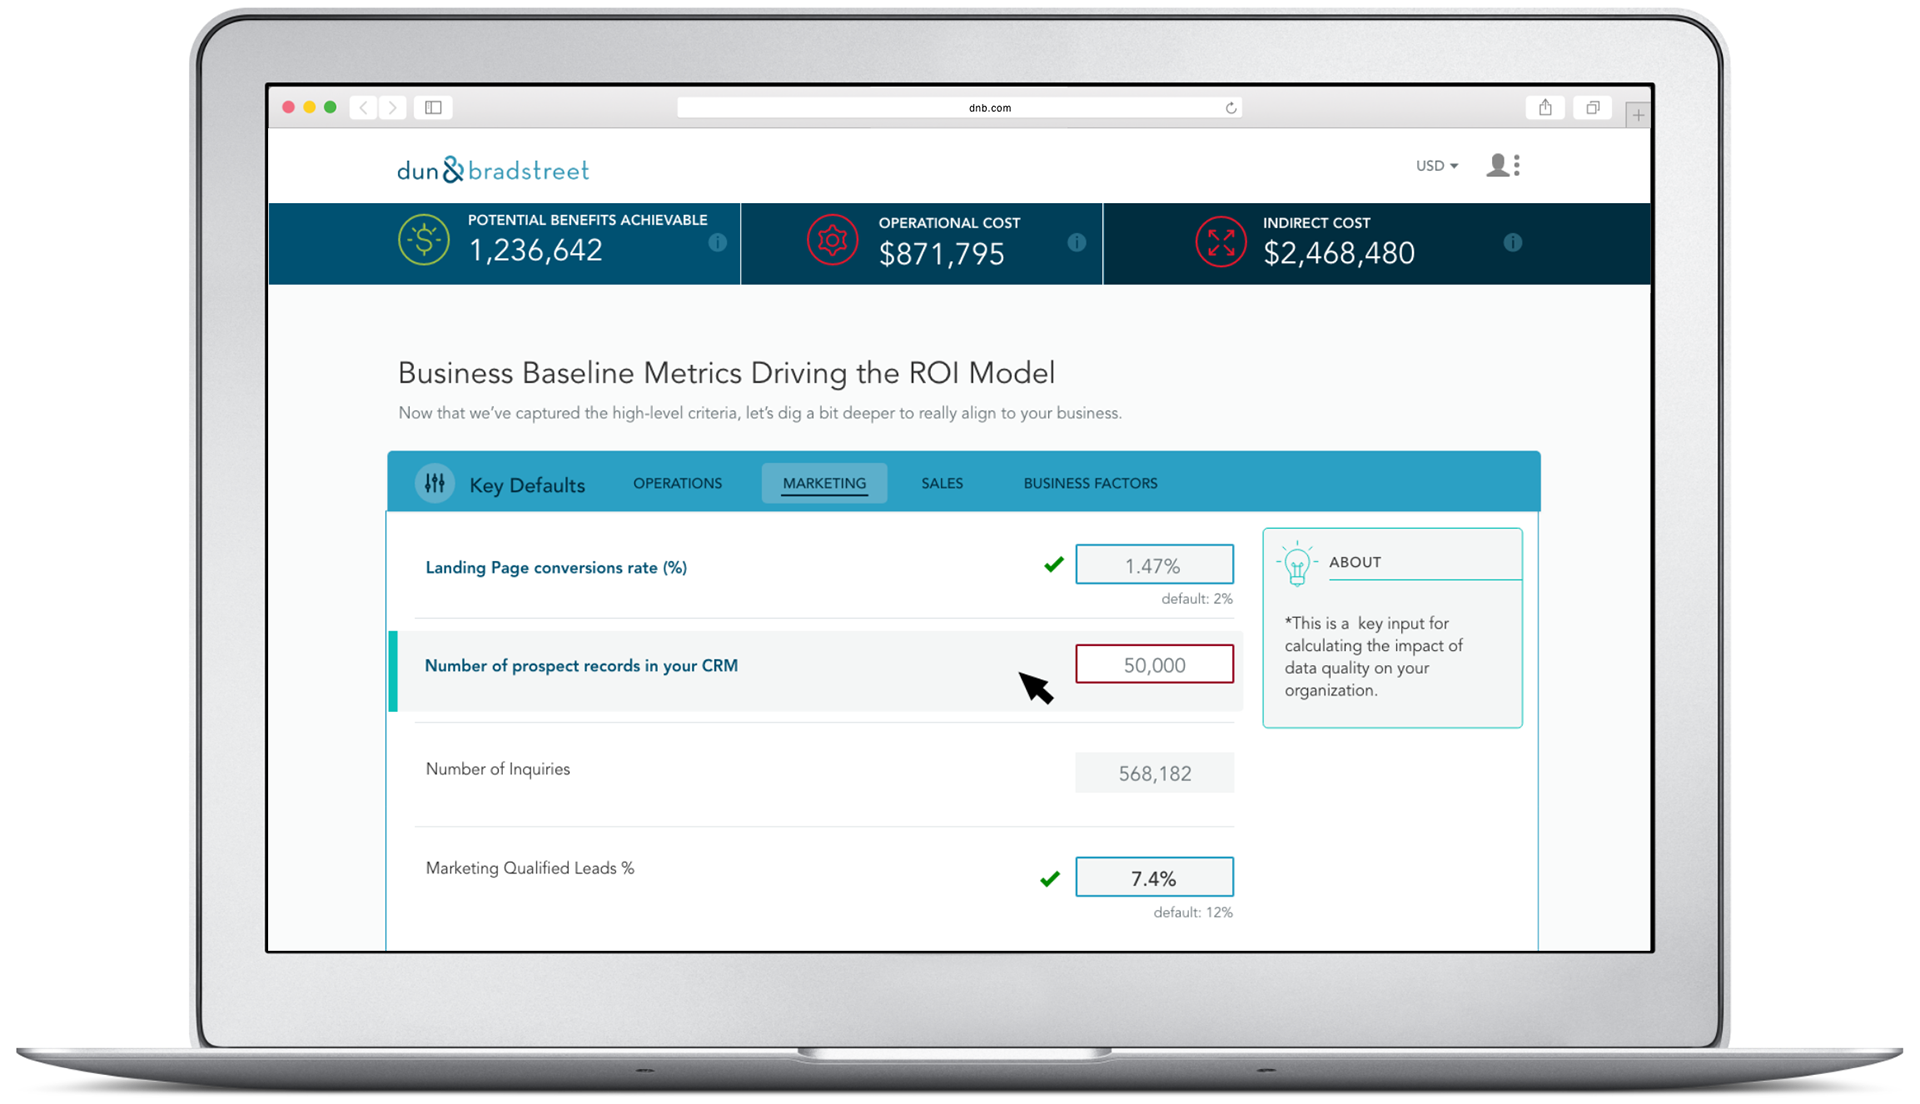
I designed 2 separate ROI Calculators, including summary reports, and worked closely with 2 development teams, to launch these fully functioning experiences within 2 months. The demand generation experience teases the full calculator with just 6, department focused metrics, that have the most impact on potential benefits and indirect cost. The sales rep will then be able to continue the conversation using the pre sales tool to tailor the defaults and identify more areas of opportunity.
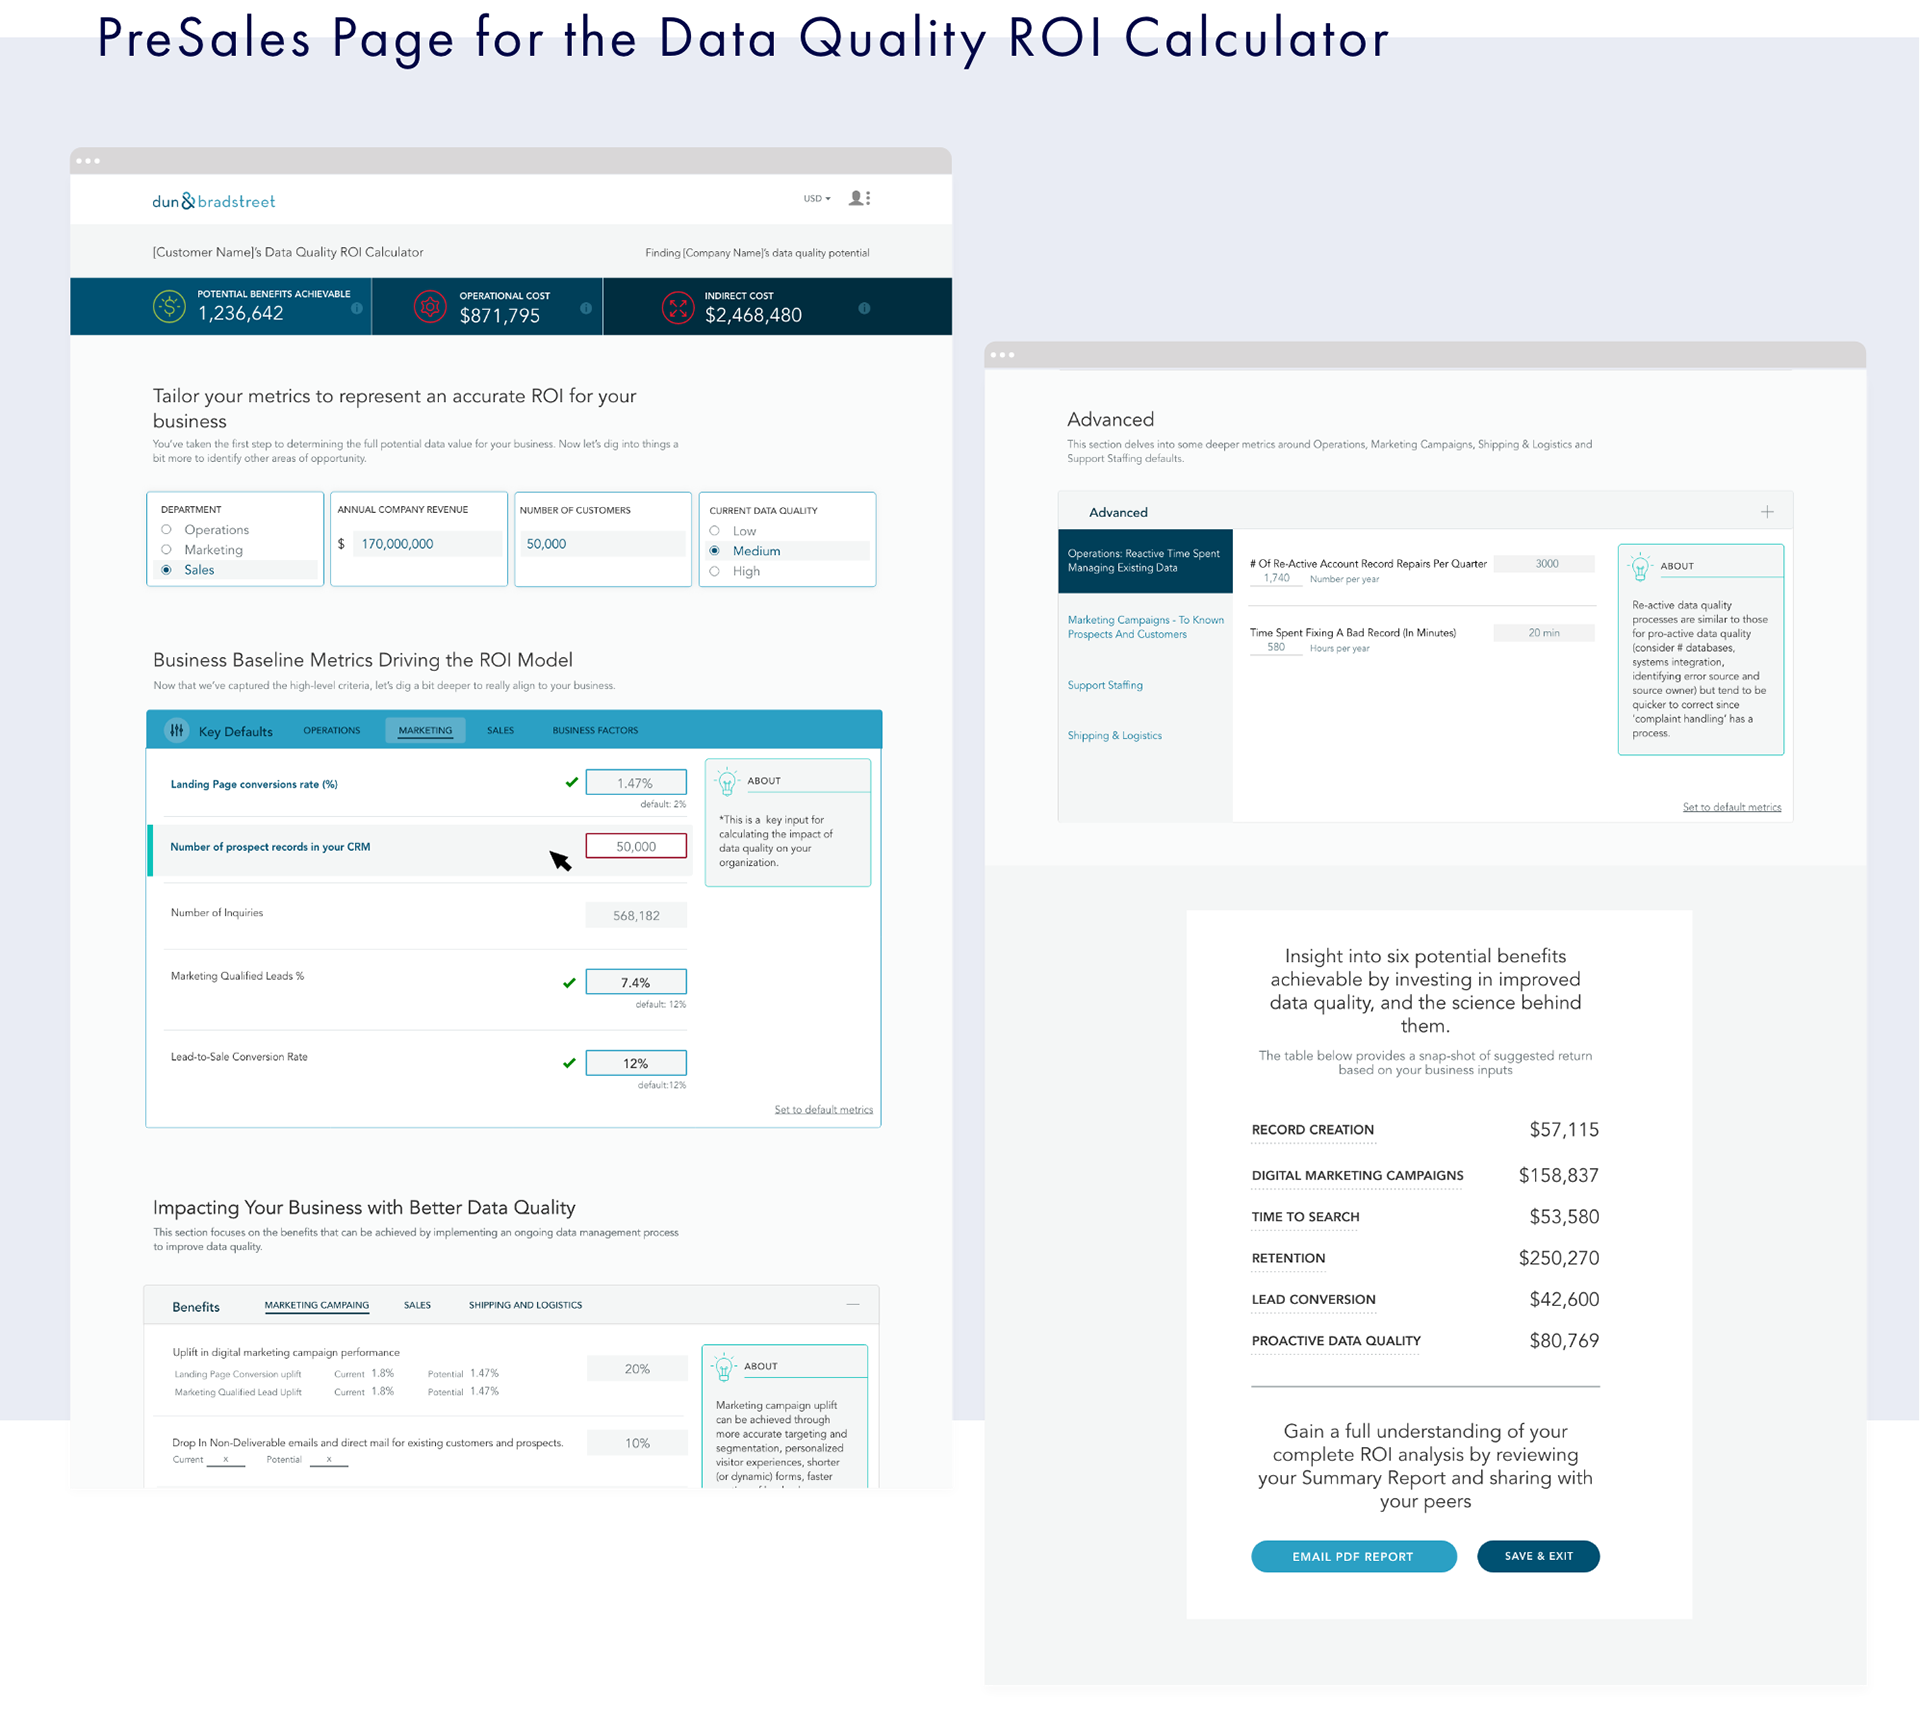
Sales rep is able to share their screen to walk through the calculator and tailor the metrics with the prospect.
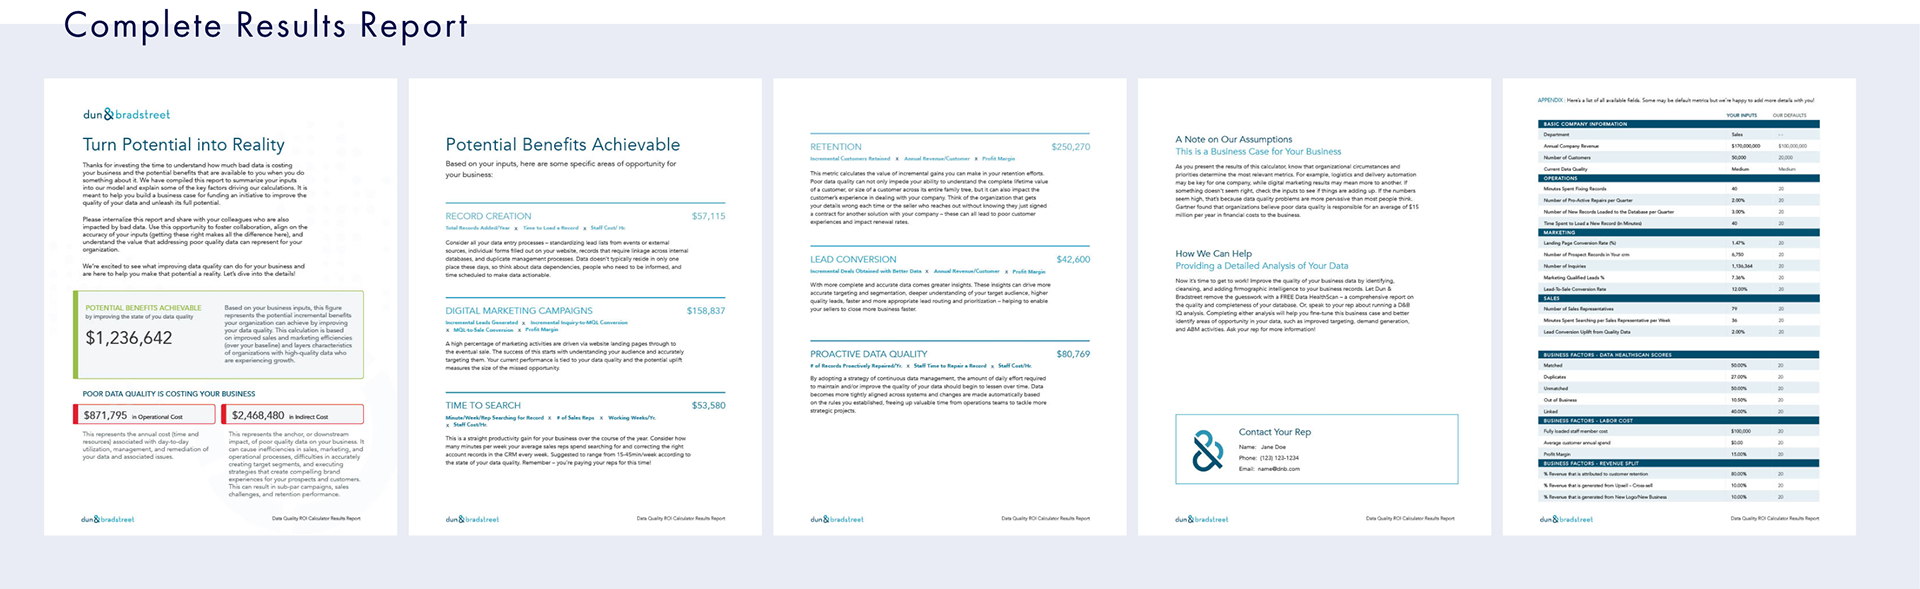
Complete report can be emailed to prospect to share with their organization.
USER TESTING
We were pleasantly surprised with the positive feed back from testing the demand generation experience. We were able to test before launch to identify any last minute potential blockers. While we were able to identify room for improvement, most people understood the purpose of how it worked, had the correct expectations, and found the results believable. There was a lot of interest around how the calculation were formulated and how they could improve their indirect cost. This was launched in early August of 2019 and is currently being monitored closely.
RESULTS
This campaign launched in August 2019. We are awaiting results, while completing more user testing with sales reps and starting phase 2 enhancements.
LEARNINGS
With the pressure of executive eyes and a tight deadline, it was difficult to redirect focus from the next feature and onto the customer. The biggest challenging was advocating for the users while balancing the business needs and time line when brought into the game so late. There is a risk when you are only thinking about key metrics within a business case or only thinking about limitations (or possibilities) with an engineering lens. As it often is, design was brought in at the end of the process when most of these things are already baked.
There is a lot of room to change the perception and the roll of design in the business beyond adding the finish touches, picking the right colors, and making everything pixel perfect.
Benefits of Prototyping
Prototype early and often! Rather than thinking it should be like this or like that, we can look at a prototype and refer to the user to re-focus the conversation.
Prototype early and often! Rather than thinking it should be like this or like that, we can look at a prototype and refer to the user to re-focus the conversation.